测量带宽使用
On the FRC® Field each team is allocated limited network bandwidth (see R704 in the 2024 manual). The FMS Whitepaper provides more information on determining the bandwidth usage of the Axis camera, but some teams may wish to measure their overall bandwidth consumption. This document details how to make that measurement.
备注
Teams can simulate the bandwidth throttling at home using the FRC Bridge Configuration Utility with the bandwidth checkbox checked.
Measuring Bandwidth Using the Performance Monitor (Win 7/10)
Windows contains a built-in tool called the Performance Monitor that can be used to monitor the bandwidth usage over a network interface.
运行性能监视器
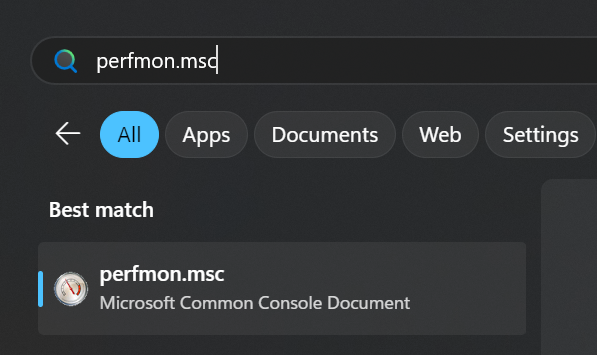
Open the Start menu and in the search box, type perfmon.msc and press Enter.
打开实时监控器
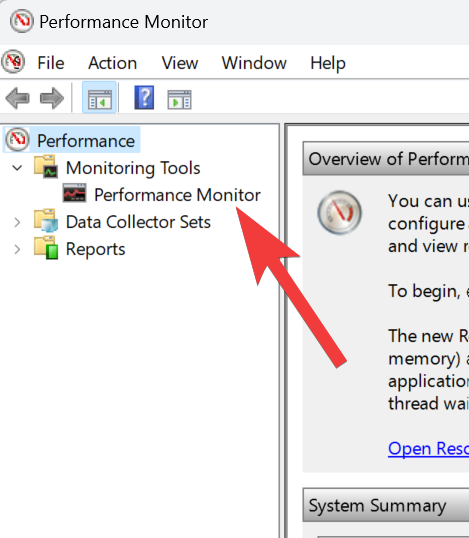
In the left pane, click Performance Monitor to display the real-time monitor.
添加网络计数器
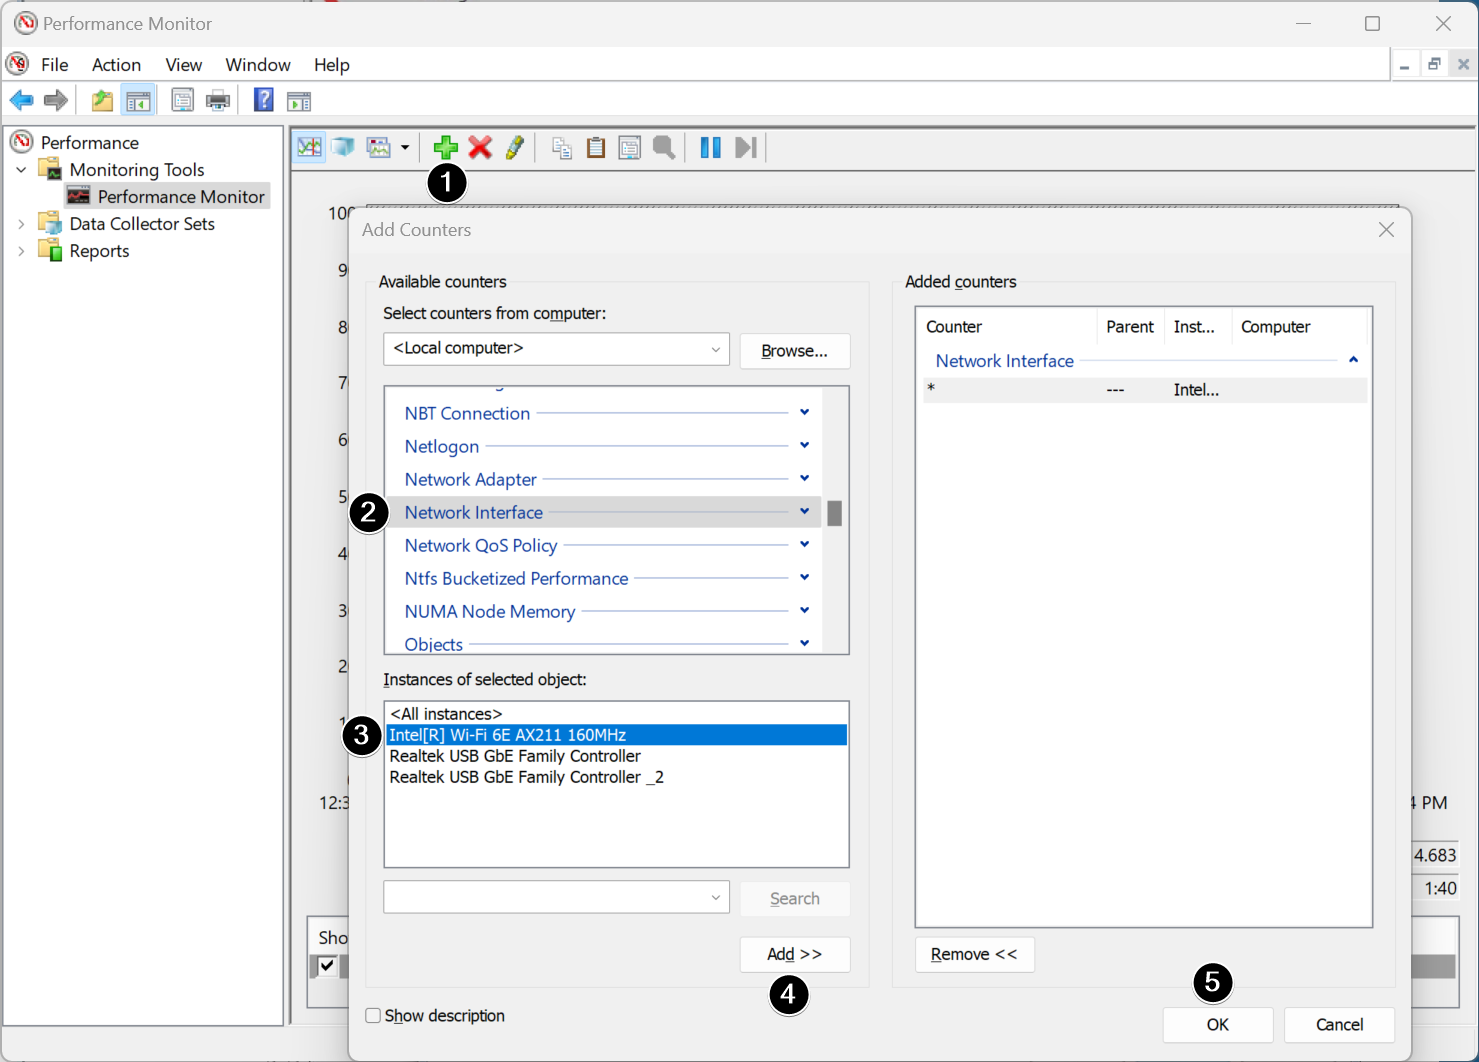
点击屏幕顶部附近的绿色加号以添加一个计数器
在左上窗格中,找到并单击“Network Interface”(网络接口)以选中它
在左下方窗格中,找到所需的网络接口(或使用“所有实例”监视所有接口)
Click Add >> to add the counter to the right pane.
Click OK to add the counters to the graph.
删除额外计数器

In the bottom pane, select each counter other than Bytes Total/sec and press the Delete key. The Bytes Total/sec entry should be the only entry remaining in the pane.
配置数据属性
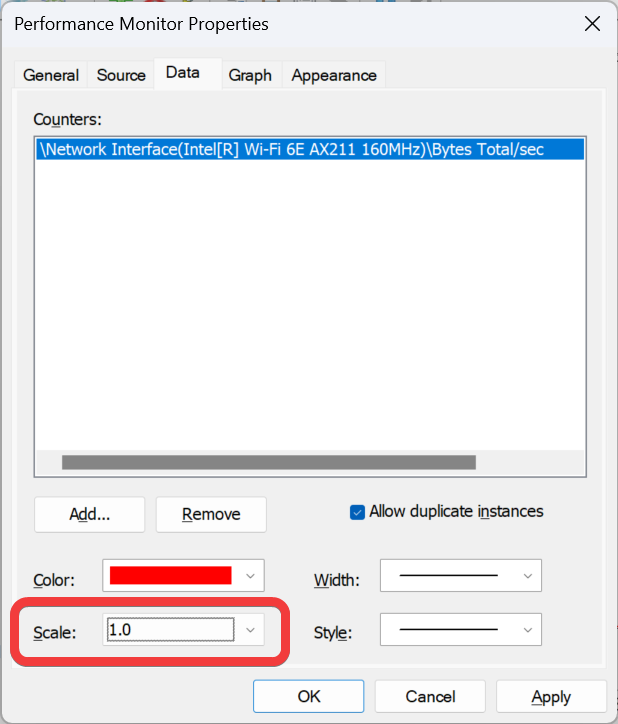
Press Ctrl+Q to bring up the Properties window. Click on the dropdown next to Scale and select 1.0. Then click on the Graph tab.
配置图形特征
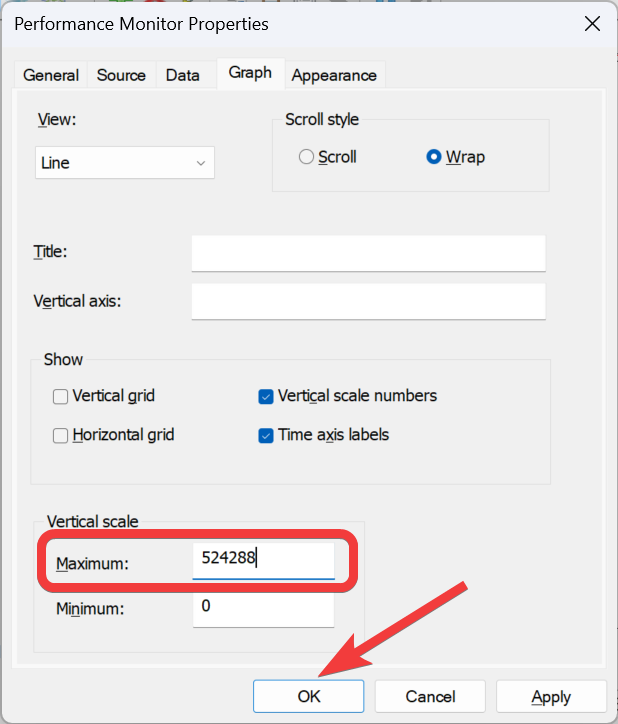
In the Maximum Box under Vertical Scale enter 524288 (this is 4 Megabits converted to Bytes). If desired, turn on the horizontal grid by checking the box. Then click OK to close the dialog.
查看带宽使用情况
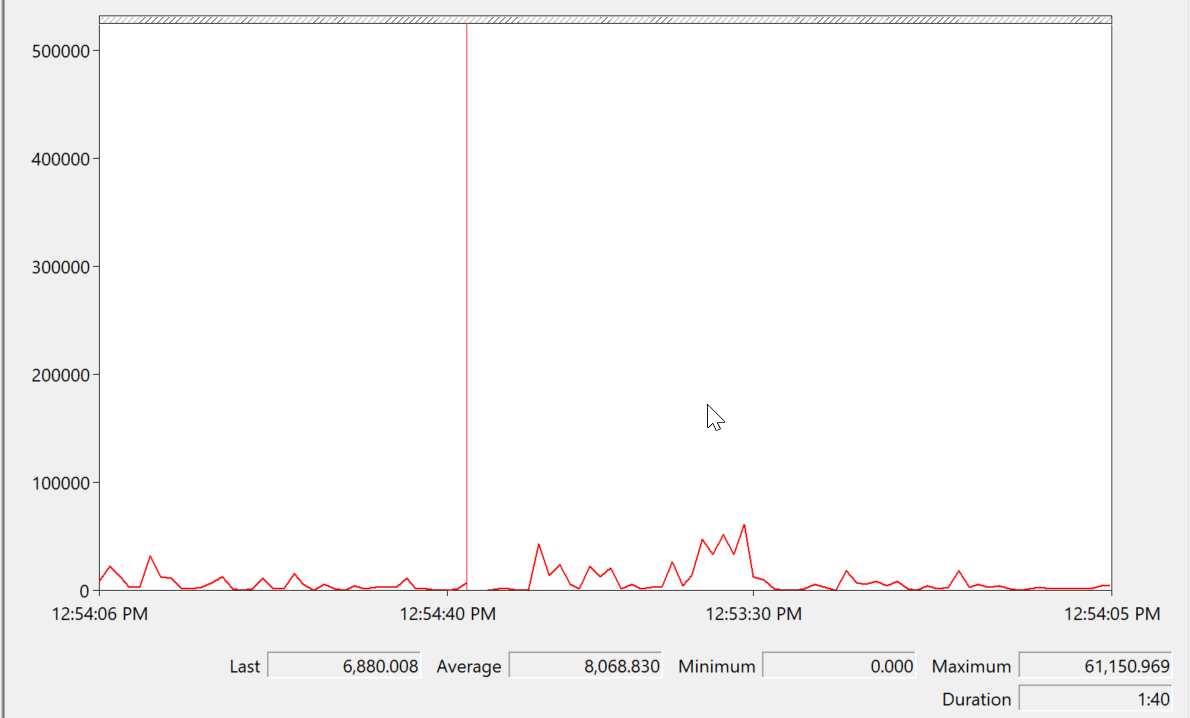
You may now connect to your robot as normal over the selected interface (if you haven’t done so already). The graph will show the total bandwidth usage of the connection, with the bandwidth cap at the top of the graph. The Last, Average, Min and Max values are also displayed at the bottom of the graph. Note that these values are in Bytes/Second meaning the cap is 524,288. With just the Driver Station open you should see a flat line at ~100000 Bytes/Second.
使用Wireshark测量带宽使用情况
If you can not use performance monitor, you will need to install a 3rd party program to monitor bandwidth usage. One program that can be used for this purpose is Wireshark. Download and install the latest version of Wireshark for your version of Windows from this page. After installation is complete, locate and open Wireshark. Connect your computer to your robot, open the Driver Station and any Dashboard or custom programs you may be using.
选择界面并开始捕获
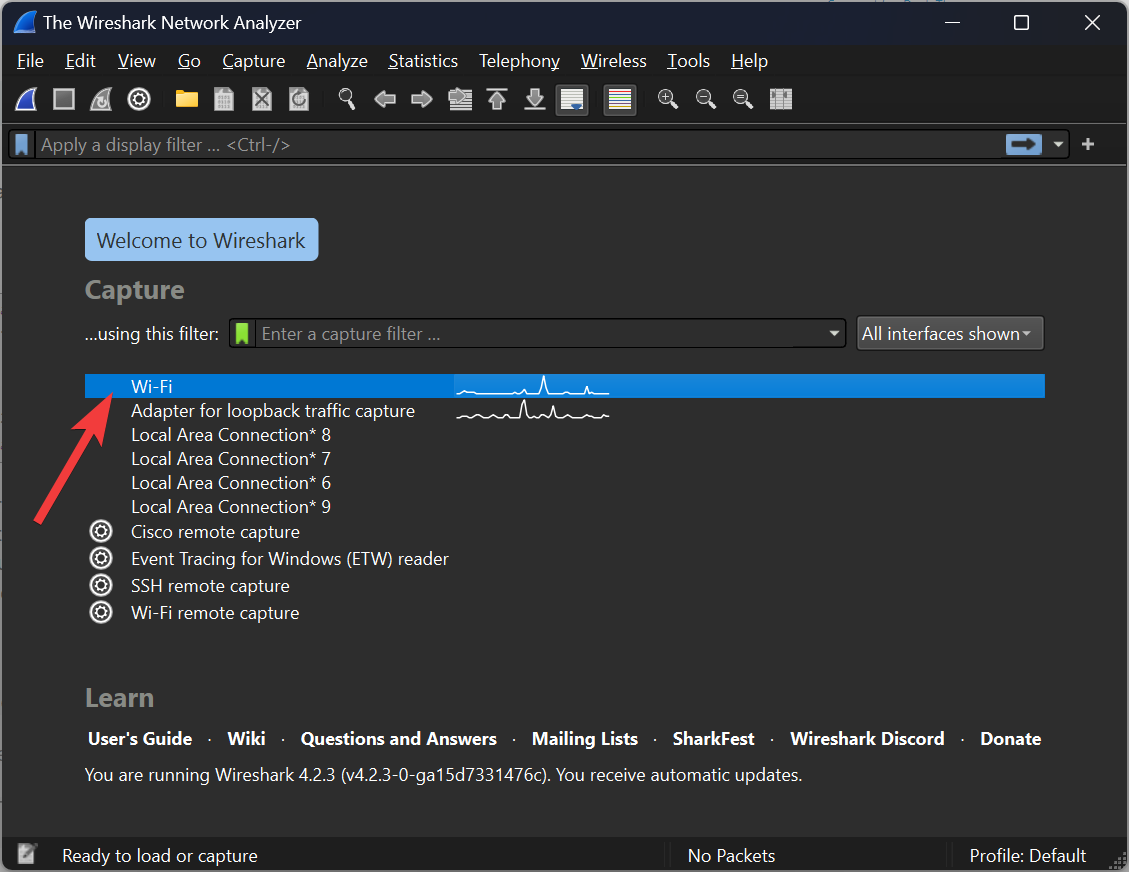
In the Wireshark program on the left side, double click the interface you are using to connect to the robot.
Open Capture File Properties

Let the capture run for at least 1 minute, then click Statistics then Capture File Properties.
查看带宽使用情况
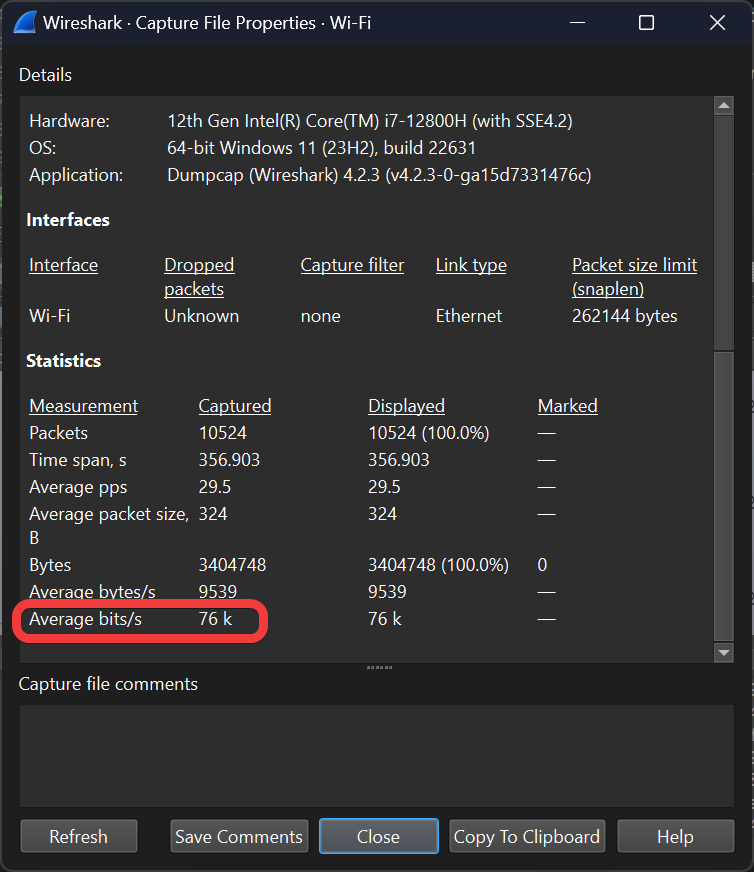
Average bandwidth usage, in bits/second is displayed near the bottom of the window.