Verifying SmartDashboard is working
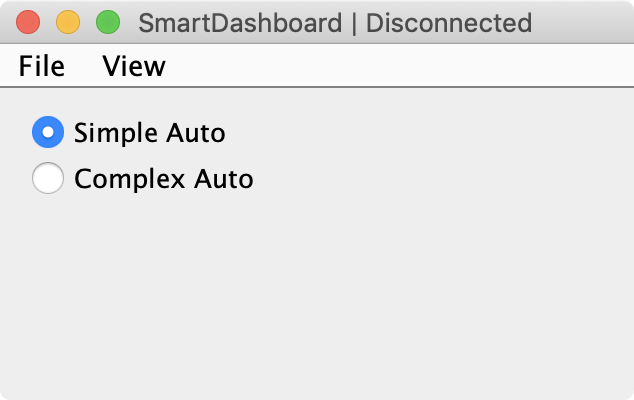
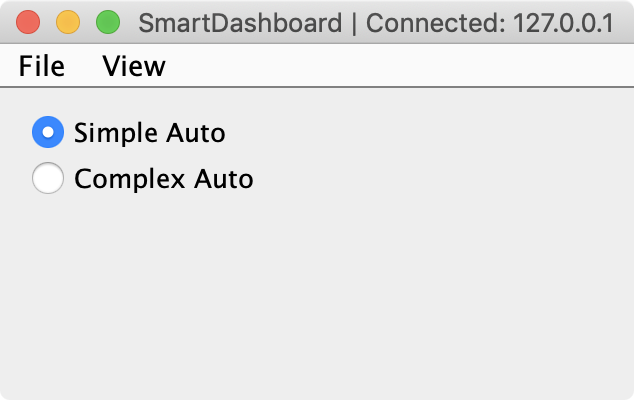
Connection Indicator
SmartDashboard will automatically include the connection status and IP address of the NetworkTables source in the title of the window.
Connection Indicator Widget
SmartDashboard includes a connection indicator widget which will turn red or green depending on the connection to NetworkTables, usually provided by the roboRIO. For instructions to add this widget, look at Adding a Connection Indicator in the SmartDashboard Intro.
Robot Program Example
public class Robot extends TimedRobot {
  double counter = 0.0;

  public void teleopPeriodic() {
    SmartDashboard.putNumber("Counter", counter++);
  }
}
#include "Robot.h"
float counter = 0.0;

void Robot::TeleopPeriodic() {
    frc::SmartDashboard::PutNumber("Counter", counter++);
}
This is a minimal robot program that writes a value to the SmartDashboard. It simply increments a counter 50 times per second to verify that the connection is working. However, to minimize bandwidth usage, NetworkTables by default will throttle the updates to 10 times per second.
SmartDashboard Output for the Sample Program
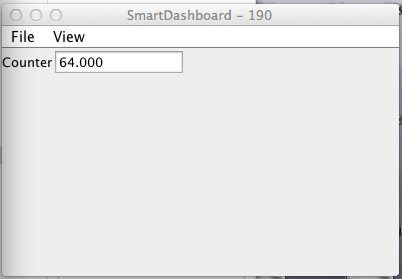
The SmartDashboard display should look like this after about 6 seconds of the robot being enabled in Teleop mode. If it doesn’t, then you need to check that the connection is correctly set up.
Verifying the IP address in SmartDashboard
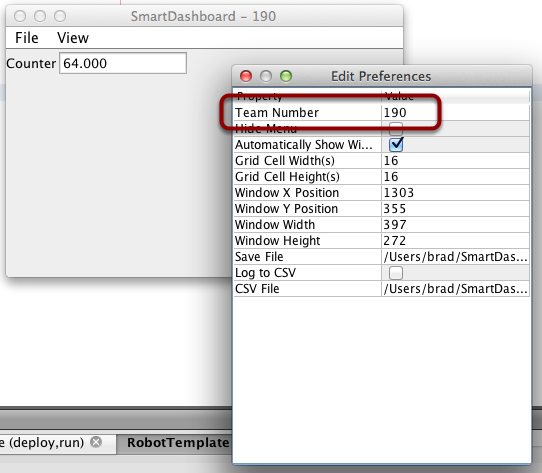
If the display of the value is not appearing, verify that the team number is correctly set as shown in this picture. The preferences dialog can be viewed by selecting File, then Preferences.
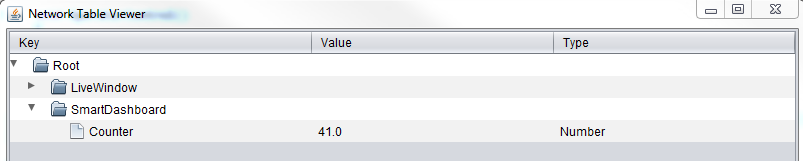
Verifying Program using OutlineViewer
You can verify that the robot program is generating SmartDashboard values by using the OutlineViewer program. This is a Java program, OutlineViewer.jar, that is located in ~/wpilib/YYYY/tools (where YYYY is the year and ~ is C:\Users\Public on Windows).
OutlineViewer is downloaded as part of the WPILib Offline Installer. For more information, see the Windows/macOS/Linux installation guides. In Visual Studio Code, press Ctrl+Shift+P and type “WPILib” or click the WPILib logo in the top right to launch the WPILib Command Palette. Select Start Tool, and then select OutlineViewer.
In the “Server Location” box, enter your team number with no leading zeroes. Then, click Start.
Look at the second row in the table, the value SmartDashboard/Counter is the variable written to the SmartDashboard via NetworkTables. As the program runs you should see the value increasing (41.0 in this case). If you don’t see this variable in the OutlineViewer, look for something wrong with the robot program or the network configuration.