Profiling with VisualVM
This document is intended to familiarize the reader with the diagnostic tool that is VisualVM for debugging Java robot programs. VisualVM is a tool for profiling JVM based applications, such as viewing why an application is using a large amount of memory. This document assumes the reader is familiar with the risks associated with modifying their robot build.gradle. This tutorial also assumes that the user knows basic terminal/commandline knowledge.
Unpacking VisualVM
To begin, download VisualVM and unpack it to the WPILib installation folder. The folder is located at ~/wpilib/ where ~ indicates the users home directory. On Windows, this is C:\Users\Public\wpilib.
Setting up Gradle
GradleRIO supports passing JVM launch arguments, and this is what is necessary to enable remote debugging. Remote debugging is a feature that allows a local machine (such as the user’s desktop) to view important information about a remote target (in our case, a roboRIO). To begin, locate the frcJava code block located in the projects build.gradle. Below is what is looks like.
15deploy {
16    targets {
17        roborio(getTargetTypeClass('RoboRIO')) {
18            // Team number is loaded either from the .wpilib/wpilib_preferences.json
19            // or from command line. If not found an exception will be thrown.
20            // You can use getTeamOrDefault(team) instead of getTeamNumber if you
21            // want to store a team number in this file.
22            team = project.frc.getTeamNumber()
23            debug = project.frc.getDebugOrDefault(false)
24
25            artifacts {
26                // First part is artifact name, 2nd is artifact type
27                // getTargetTypeClass is a shortcut to get the class type using a string
28
29                frcJava(getArtifactTypeClass('FRCJavaArtifact')) {
30                }
31
32                // Static files artifact
33                frcStaticFileDeploy(getArtifactTypeClass('FileTreeArtifact')) {
34                    files = project.fileTree('src/main/deploy')
35                    directory = '/home/lvuser/deploy'
36                }
37            }
38        }
39    }
40}
We will be replacing the highlighted lines with:
frcJava(getArtifactTypeClass('FRCJavaArtifact')) {
   // Enable VisualVM connection
   jvmArgs.add("-Dcom.sun.management.jmxremote=true")
   jvmArgs.add("-Dcom.sun.management.jmxremote.port=1198")
   jvmArgs.add("-Dcom.sun.management.jmxremote.local.only=false")
   jvmArgs.add("-Dcom.sun.management.jmxremote.ssl=false")
   jvmArgs.add("-Dcom.sun.management.jmxremote.authenticate=false")
   jvmArgs.add("-Djava.rmi.server.hostname=10.XX.XX.2") // Replace XX.XX with team number
}
We are adding a few arguments here. In order:
Enable remote debugging
Set the remote debugging port to 1198
Allow listening from remote targets
Disable SSL authentication being required
Set the hostname to the roboRIOs team number. Be sure to replace this.
重要
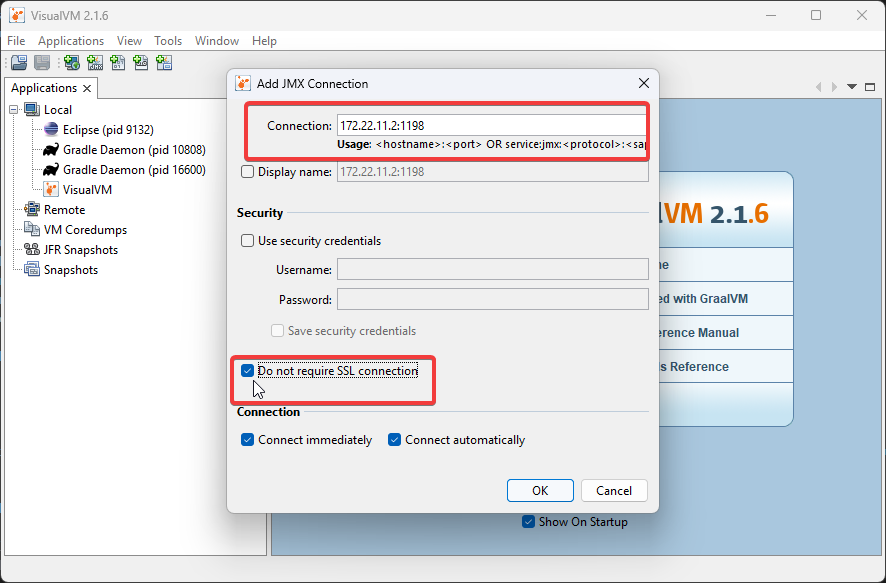
The hostname when connected via USB-B should be 172.22.11.2.
Running VisualVM
Launching VisualVM is done via the commandline with a few parameters. First, we navigate to the directory containing VisualVM. Then, launch it with parameters, passing it the WPILib JDK path. On a Windows machine, it looks like the following:
cd "C:\Users\Public\wpilib\visualvm_217\bin"
./visualvm --jdkhome "C:\Users\Public\wpilib\2024\jdk"
重要
The exact path visualvm_217 may vary and depends on the version of VisualVM downloaded.
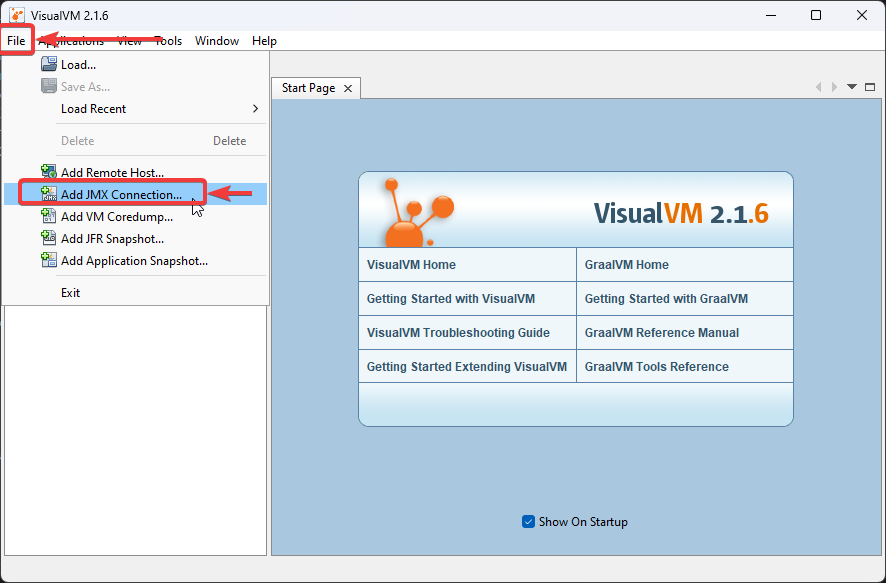
This should launch VisualVM. Once launched, open the Add JMX Connection dialog.
Once opened, configure the connection details and hostname. Ensure that Do not require SSL connection is ticked.
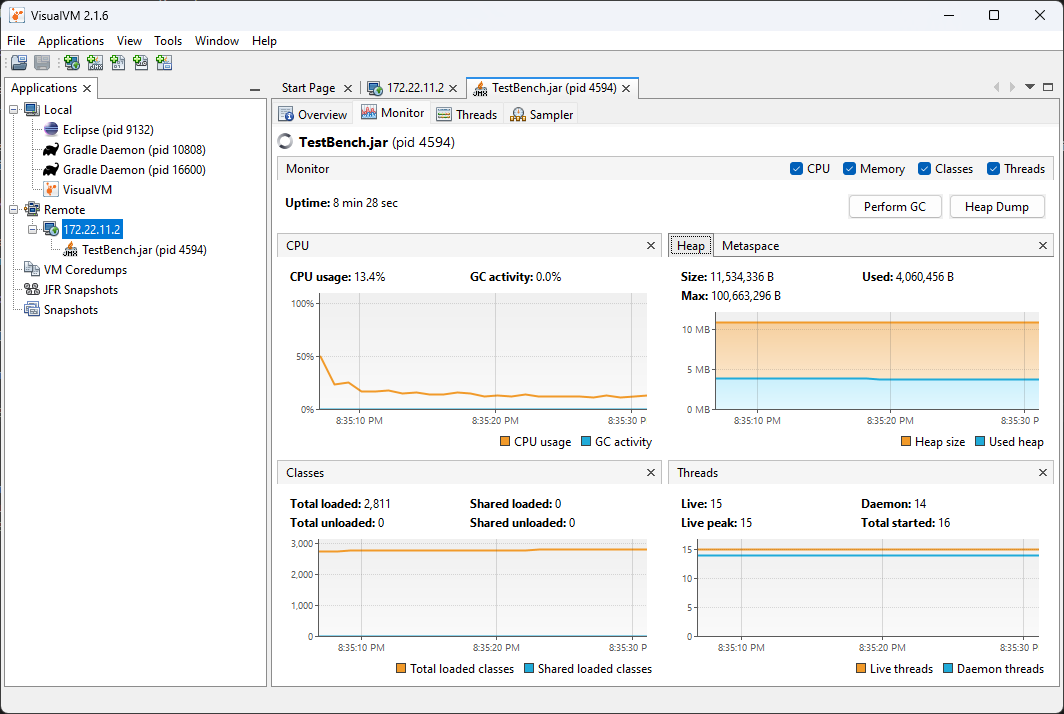
If correctly done, a new menu option in the left-hand sidebar will appear. Clicking on it will show you a detailed dashboard of the running JVM application.
Analyzing Function Timings
An important feature of VisualVM is the ability to view how much time a specific function is taking up. This is without having a code debugger attached. To begin, click on the Sampler tab and then click on CPU. This will immediately give a breakdown of what functions are taking CPU time.
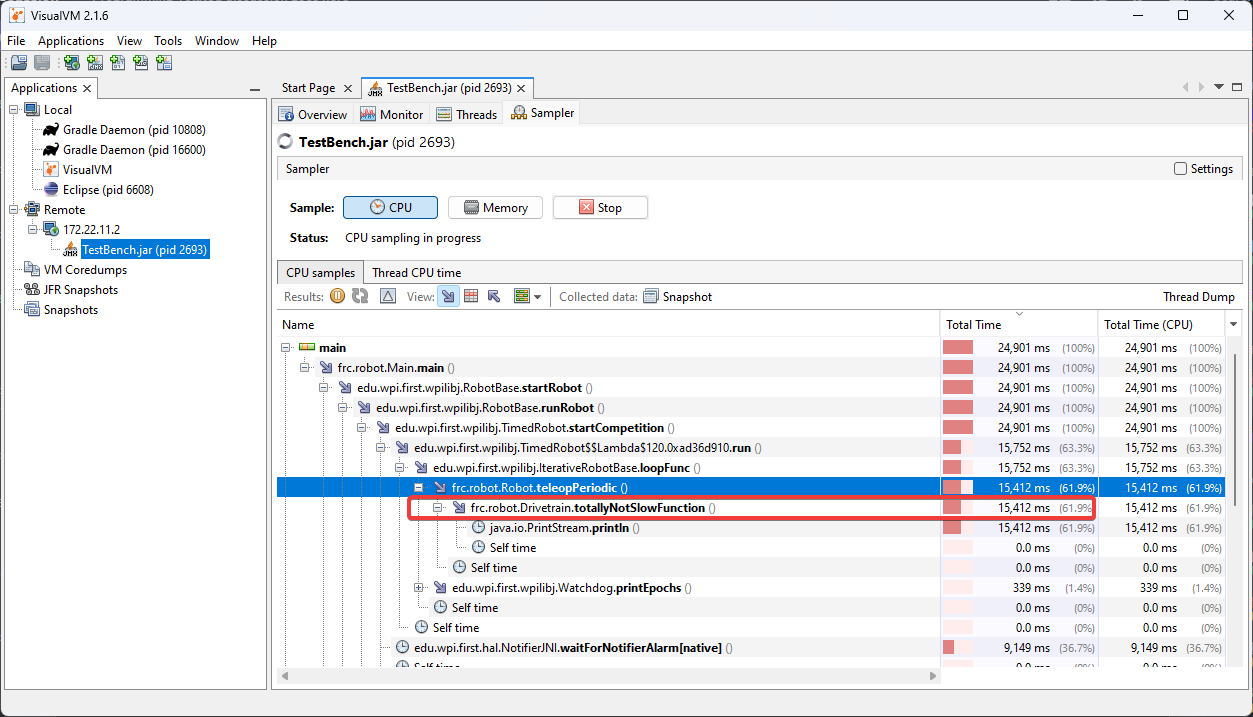
The above screenshot shows a breakdown of the total time a specific function takes. You can see that totallyNotSlowFunction() accounts for 61.9% of the robot program CPU time. We can then correlate this to our robot program. In totallyNotSlowFunction(), we have the following code.
public static void totallyNotSlowFunction() {
   for (int i = 0; i < 2000; i++) {
      System.out.println("HAHAHAHA");
   }
}
In this code snippet, we can identify 2 major causes of concern. A long running for loop blocks the rest of the robot program from running. Additionally, System.out.println() calls on the roboRIO are typically quite expensive. We found this information by profiling the Java application on the roboRIO!
Creating a Heap Dump
Besides viewing the remote systems CPU and memory usage, VisualVM is most useful by creating a Heap Dump. When a Java object is created, it resides in an area of memory called the heap. When the heap is full, a process called garbage collection begins. Garbage collection can be a common cause of loop overruns in a traditional Java robot program.
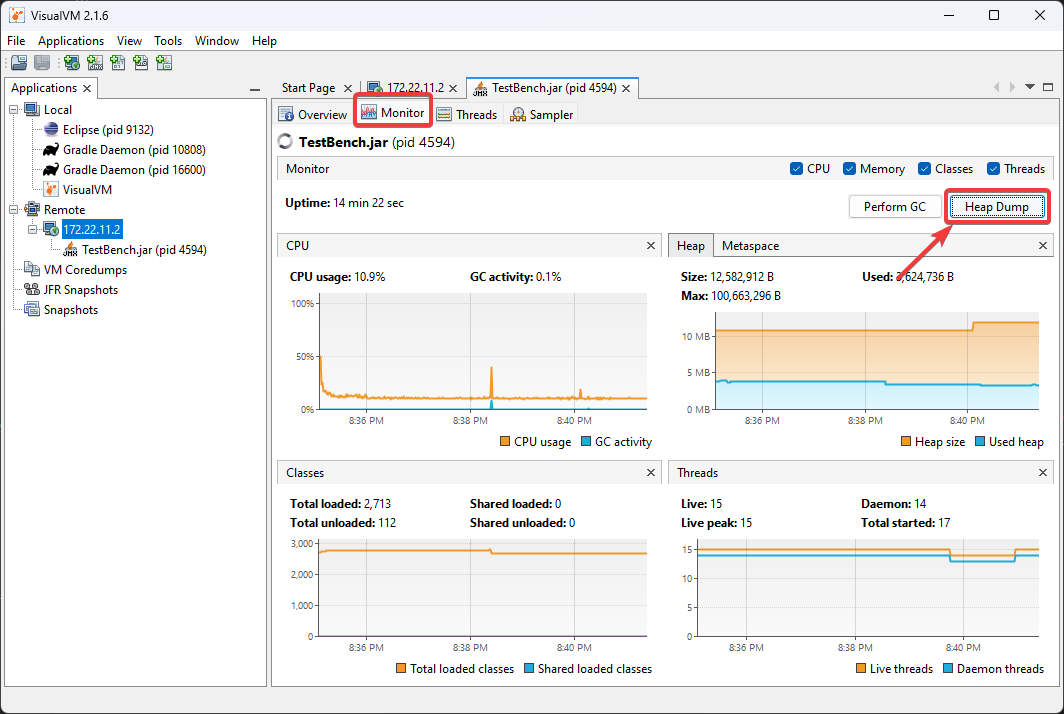
To begin, ensure you are on the Monitor tab and click Heap Dump.
This heap dump will be stored on the target system (roboRIO) and must be retrieved using SFTP. See this article for information on retrieving the dump from the roboRIO.
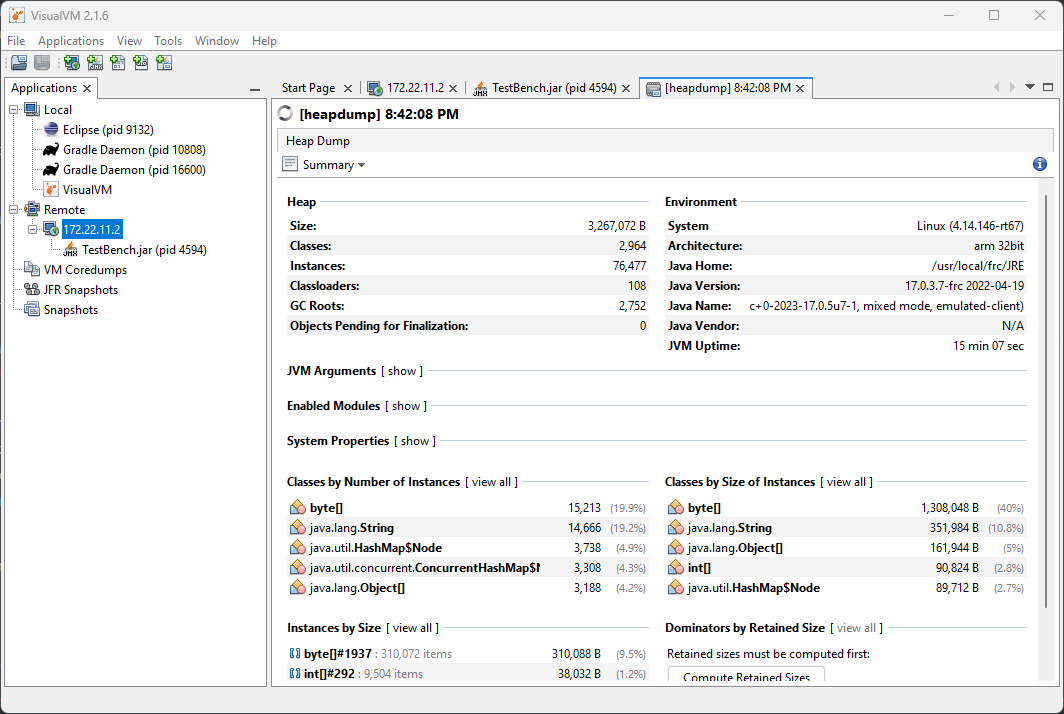
Once downloaded, the dump can be analyzed with VisualVM.
Analyzing a Heap Dump
Reopen VisualVM if closed using the previous instructions. Then click on File and Load. Navigate to the retrieved dump file and load it.
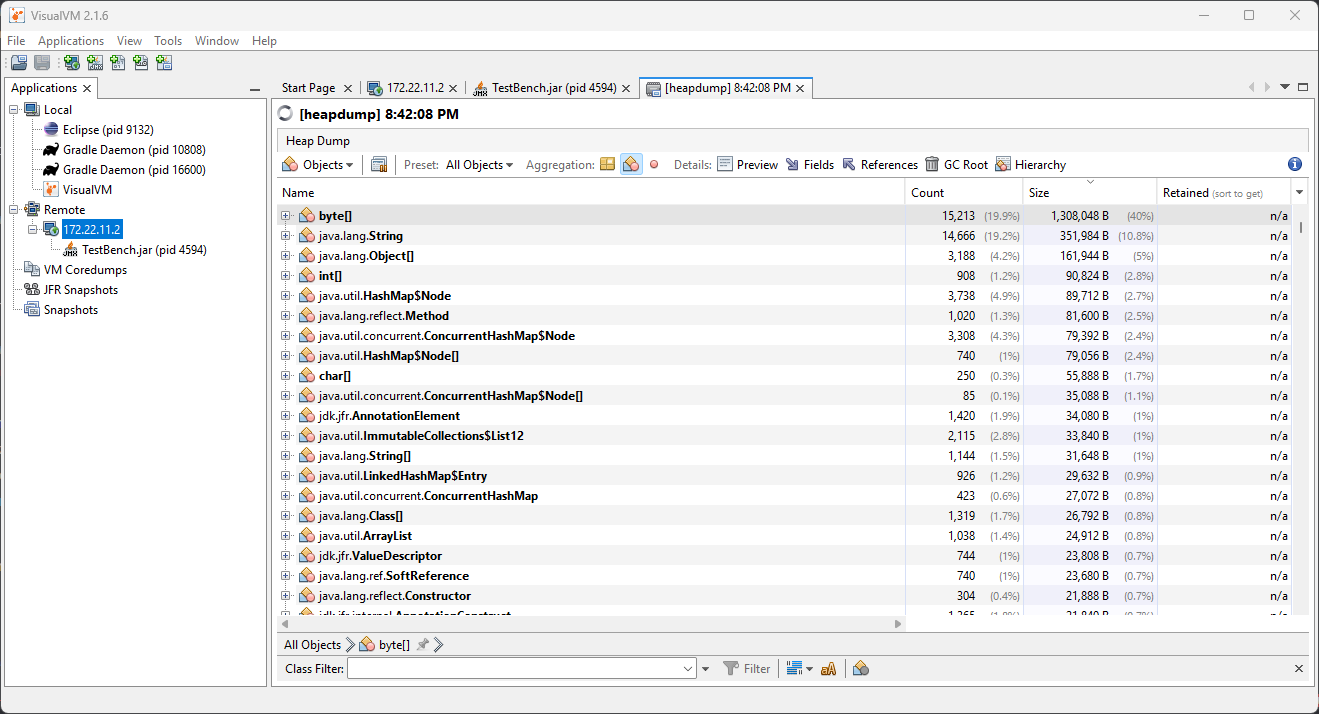
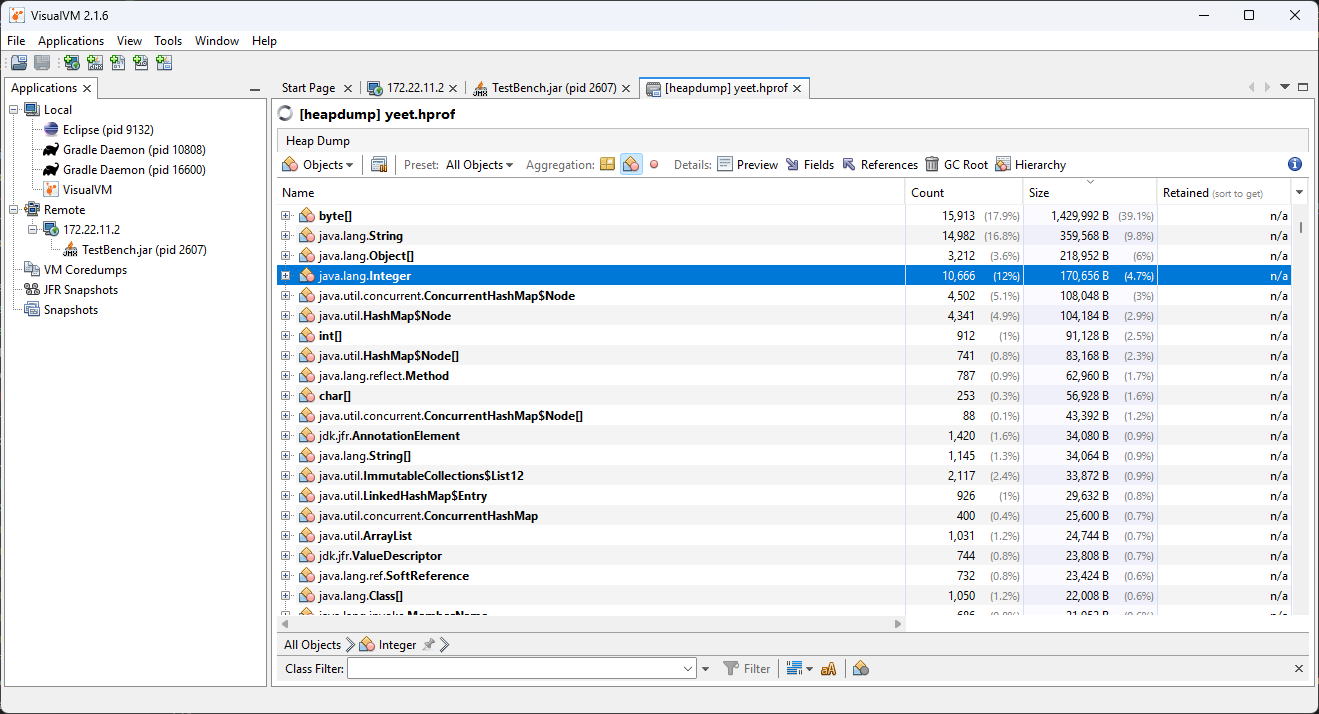
Clicking on Summary and selecting Objects instead will show a breakdown of objects by quantity. The below screenshot showcases a completely empty robot program, and then one that creates an million large ArrayList of integers.
Blank robot program:
with an ArrayList of ~10000 integers.
Additional Info
For more information on VisualVM, check out the VisualVM documentation pages.