FRC Driver Station (由NI LabVIEW提供支持)
这篇文章讲的是FRC ® Driver Station (由NI LabVIEW提供支持) 的使用和特性。
关于安装 Driver Station 软件的信息,请参见本文档:5.4 Installing the FRC Game Tools
启动 FRC Driver Station
The FRC Driver Station can be launched by double-clicking the icon on the Desktop or by selecting Start->All Apps->FRC Driver Station.
备注
By default the FRC Driver Station launches the LabVIEW Dashboard. It can also be configured on 设置栏 to launch the other Dashboards: SmartDashboard and Shuffleboard. WPILib must be installed to use SmartDashboard and Shuffleboard.
Driver Station 快捷键
F1 - Force a Joystick refresh.
[ + ] + \ - Enable the robot (the 3 keys above Enter on most keyboards)
Enter - Disable the Robot
Space - Emergency Stop the robot. After an emergency stop is triggered the roboRIO will need to be rebooted before the robot can be enabled again.
备注
无论Driver Station是否有键盘焦点,空格键都会紧急停止机器人
警告
When connected to FMS in a match, teams must press the Team Station E-Stop button to emergency stop their robot as the DS enable/disable and E-Stop key shortcuts are ignored.
设置 Driver Station

Driver Station 应该被设置成你的队伍号,才能连上你的机器人。单击Setup按钮,然后在“队伍号”一栏里面输入你的队伍号。按回车或者单击窗口外面来完成设置。
PCs will typically have the correct network settings for the DS to connect to the robot already, but if not, make sure your Network adapter is set to DHCP.
状态栏
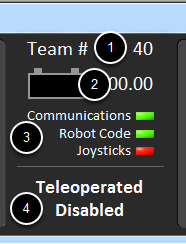
Driver Station 的状态栏位于显示屏的中央,并且无论选择哪个选项,它将始终可见。它将显示有关Driver Station和机器人状态的重要信息:
Team # - 是Driver Station 当前配置的队号。这应该匹配您的 FRC 队号。要更改Driver Station中的队号,请参阅“设置选项”。
Battery Voltage (电池电压)- 如果 Driver Station 已连接至 roboRio 并与其通信,则会在电池图标中以数字形式显示当前电池电压,并显示一小段电压-时间图表。当 roboRIO 掉电情况发生时,数字指示器的背景将变为红色。有关更多信息,请参见本文档:29.4 roboRIO Brownout and Understanding Current Draw
Maor Status Indicator (主要状态指示器) - 这三个指示器显示 Driver Station 的主要状态项目。 “Communication” 指示 Driver Station 当前是否正在与 roboRIO 上的 FRC网络通信任务进行通信( 通信被分为 TCP 和 UDP 通信)。 “The Robot Code” 指示器显示机器人代码当前是否正在运行(是否运行由机器人代码中的 Driver Station Task 是否更新电池电压来确定)。 “Joysticks” 指示器显示是否至少插入了一个操纵杆,并被 Driver Station 识别。
Status String - The Status String provides an overall status message indicating the state of the robot. Some examples are “No Robot Communication”, “No Robot Code”, “Emergency Stopped”, and “Teleoperated Enabled”. When the roboRIO brownout is triggered this will display “Voltage Brownout”.
Operation Tab (操作标签)

“Operation Tab” 用于控制机器人的操作模式,并在机器人运行时提供其他的关键状态指示。
Robot Mode - This section controls the Robot Mode.
Teleoperated Mode causes the robot to run the code in the Teleoperated portion of the match.
Autonomous Mode causes the robot to run the code in the Autonomous portion of the match.
Practice Mode causes the robot to cycle through the same transitions as an FRC match after the Enable button is pressed (timing for practice mode can be found on the setup tab).
Test Mode is an additional mode where test code that doesn’t run in a regular match can be tested.
Enable/Disable - These controls enable and disable the robot. See also Driver Station Key Shortcuts.
Elapsed Time - Indicates the amount of time the robot has been enabled.
PC Battery - Indicates current state of DS PC battery and whether the PC is plugged in.
PC CPU% - Indicates the CPU Utilization of the DS PC.
Window Mode - When not on the Driver account on the Classmate allows the user to toggle between floating (arrow) and docked (rectangle).
Team Station-未连接到FMS时,向机器人传输Team Station设置
备注
When connected to the Field Management System the controls in sections 1 and 2 will be replaced by the words FMS Connected and the control in Section 7 will be greyed out.
Diagnostics Tab (诊断标签)
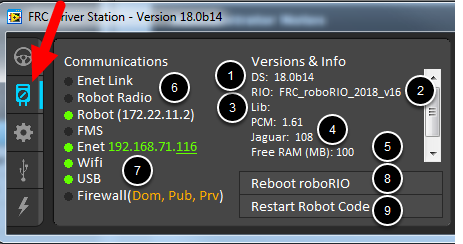
Dianostics Tab包含额外的状态指示器,团队可以使用这些指示器来诊断其机器人的问题:
DS Version - Indicates the Driver Station Version number.
roboRIO Image Version - String indicating the version of the roboRIO Image.
WPILib Version - String indicating the version of WPILib in use.
CAN Device Versions - String indicating the firmware version of devices connected to the CAN bus. These items may not be present if the CTRE Phoenix Framework has not been loaded.
Memory Stats - This section shows stats about the roboRIO memory.
Connection Indicators (连接指示器) - 指示器的上半部分会显示多个组件的连接状态
“Enet Link” (局域网连接) 会指示电脑是否连接上了ethernet网线接口
“Robot Radio” (机器人信号) 会指示在10.XX.YY.1机器人无线桥接的延迟ping值
“Robot”会指示在使用 mDNS 时 (后面带有静态10.TE.AM.2地址) roboRIO的延迟ping值
“FMS”(场控) 会指示Driver Station是否从FMS收到数据包 (这不是个ping指示器)
Network Indicators - The second section of indicators indicates status of network adapters and firewalls. These are provided for informational purposes; communication may be established even with one or more unlit indicators in this section.
“Enet” (以太网) 会指示所检测到的 Ethenet adapter 的IP地址
“WiFi” 会指示是否已经启用无线网卡
“USB” 会指示是否检测到roboRIO已经使用USB连接
“Firewall” indicates if any firewalls are detected as enabled. Enabled firewalls will show in orange (Dom = Domain, Pub = Public, Prv = Private)
Reboot roboRIO - This button attempts to perform a remote reboot of the roboRIO (after clicking through a confirmation dialog).
Restart Robot Code - This button attempts to restart the code running on the robot (but not restart the OS).
设置栏
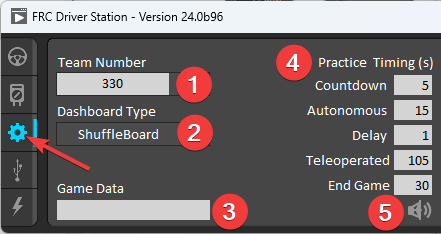
设置栏包含一系列按钮,可以用来控置Driver Station的操作
Team Number - Should contain your FRC Team Number. This controls the mDNS name that the DS expects the robot to be at. Shift clicking on the dropdown arrow will show all roboRIO names detected on the network for troubleshooting purposes.
Dashboard Type - Controls what Dashboard is launched by the Driver Station. Default launches the file pointed to by the “FRC DS Data Storage.ini” (for more information about setting a custom dashboard). By default this is Dashboard.exe in the Program Files (x86)\FRC Dashboard folder. LabVIEW attempts to launch a dashboard at the default location for a custom built LabVIEW dashboard, but will fall back to the default if no dashboard is found. SmartDashboard and Shuffleboard launch the respective dashboards included with the C++ and Java WPILib installation. Remote forwards LabVIEW dashboard data to the IP specified in Dashboard IP field.
Game Data - This box can be used for at home testing of the Game Data API. Text entered into this box will appear in the Game Data API on the Robot Side. When connected to FMS, this data will be populated by the field automatically.
Practice Mode Timing (练习模式时序) - 这些窗口制练习模式序列各部分的时序。在练习模式下启用机器人后,Driver Station 会自动执行从上到下的指示。
Audio Control (音频控制) - 此按钮控制使用练习模式时是否发出音频。
USB 设备栏
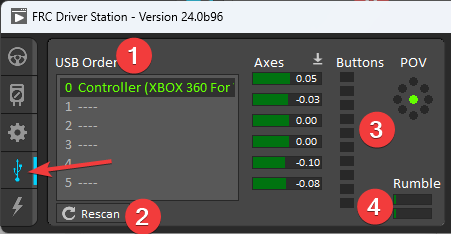
USB设备栏包括有关连接到 Driver Station 的USB设备的信息
USB Setup List (USB 设置列表) - 这包含连接到 Driver Station 的所有兼容USB设备的列表。按下设备上的按钮将以绿色突出显示名称,并在设备名称前加2 * s
Rescan - This button will force a Rescan of the USB devices. While the robot is disabled, the DS will automatically scan for new devices and add them to the list. To force a complete re-scan or to re-scan while the robot is Enabled (such as when connected to FMS during a match) press F1 or use this button.
Device indicators (设备指示器) - 这些指示器显示 Joystick 手柄的轴、按钮和POV的状态
Rumble (蜂鸣器) - 对于X输入设备 (例如Xbox控制器) 会出现蜂鸣器控制。这可以用于测试设备的蜂鸣功能。最上面一栏是 “Right Rumble” (右蜂鸣器),最下面一栏是 “Left Rumpble” (左蜂鸣器)。单击并按住任何蜂鸣器栏将启动部分蜂鸣器 (左侧是 rumble = 0,右侧是 rumbelr = 1)。这只能用来控制,不会指示机器人代码里的蜂鸣器的值。
Re-Arranging and Locking Devices (重新排序和锁定设备)
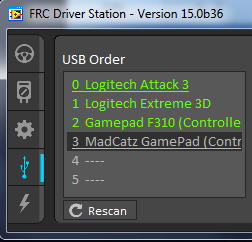
The Driver Station has the capability of “locking” a USB device into a specific slot. This is done automatically if the device is dragged to a new position and can also be triggered by double clicking on the device. “Locked” devices will show up with an underline under the device. A locked device will reserve its slot even when the device is not connected to the computer (shown as grayed out and underlined). Devices can be unlocked (and unconnected devices removed) by double clicking on the entry.
备注
If you have two or more of the same device, they should maintain their position as long as all devices remain plugged into the computer in the same ports they were locked in. If you switch the ports of two identical devices the lock should follow the port, not the device. If you re-arrange the ports (take one device and plug it into a new port instead of swapping) the behavior is not determinate (the devices may swap slots). If you unplug one or more of the set of devices, the positions of the others may move; they should return to the proper locked slots when all devices are reconnected.
例如:上面的图片有4个设备
一个锁定的”Logitech Attack 3”手柄。这个设备会待在这各位,除非被拽到了别的插槽或者解锁
一个解锁的“Logitech Extreme 3D”手柄
一个解锁的“Gamepad F310 (Controller)”是一个 Logitech F310 gamepad
一个锁定但断开的 ”MadCatz GamePad (Controller)”,这是一个 MadCatz Xbox 360 Controller。
在此示例中,拔下Logitech Extreme 3D游戏杆将导致F310游戏手柄向上移动到插槽1。插入MadCatz游戏手柄(即使已卸下插槽1和2中的设备并且这些插槽为空)也会导致其占用插槽3。
CAN/Power 选项
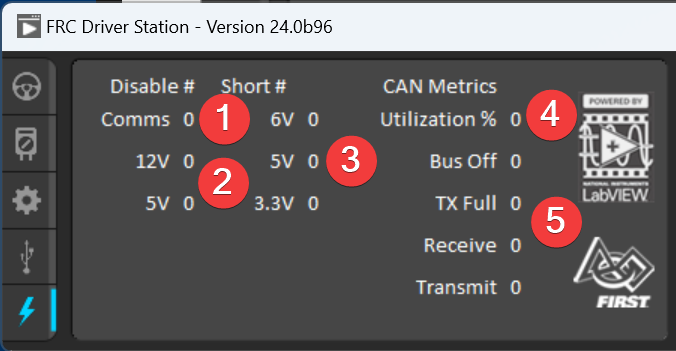
Driver Station 左边一栏最后一个选项是 CAN/Robot Powe 选项。这个选项包含 roboRIO 供电信息和 CAN 线的状态。
Comms Faults (Comms 故障) - 显示 Driver Station 连接后出现了多少个 Comms 故障
12V Faults (12V故障) - 显示 Driver Station 连接后出现多少个输入电流故障 (电压过低)。
6V/5V/3.3V Faults - Indicates the number of faults (typically caused by short circuits) that have occurred on the User Voltage Rails since the DS has been connected
CAN Bus Utilization (CAN Bus 使用率) - 指示CAN线的占用率
CAN faults (CAN 线故障) - 指示 Driver Station 连接之后出现的4种CAN线错误的数量
如果检测到故障,这一栏的指示器 (上图显示的是蓝色) 会变红。
信息栏
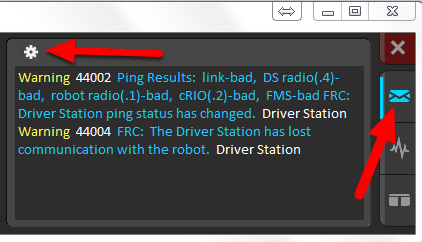
The Messages tab displays diagnostic messages from the DS, WPILib, User Code, and/or the roboRIO.
To access settings for the Messages tab, click the Gear icon. This will display a menu that will allow you to clear the box, launch a larger Console window for viewing messages, launch the DS Log Viewer, launch a viewer for program timing, or download log files from the robot.
图标栏
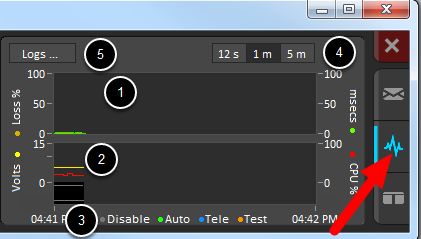
图标栏会绘制并显示更高级的机器人状态指示器,来帮助队伍诊断机器人的问题:
The top graph charts trip time in milliseconds in green (against the axis on the right) and lost packets per second in orange (against the axis on the left).
底部图形以黄色(相对于左侧的轴)绘制电池电压,roboRIO CPU以红色(相对于右侧的轴)绘制,DS Requested模式为图表底部的实线,而Robot模式为它上面不连续线。
此按键在底图中显示用于“ DS请求”和“机器人报告”模式的颜色。
Chart scale - These controls change the time scale of the DS Charts.
This button launches the DS Log File Viewer.
DS Requested 模式是 Driver Station 命令机器人进入的模式。Robot Reported 模式是基于每种语言的编码框架中包含的报告方法实际运行的代码。
双窗口栏
The last tab on the right side is the Both tab which displays Messages and Charts side by side.